Weightscan: squeezing transformer hidden states into 3d
The inner operation of the transformer-based language model eludes scientific explanation. Text goes in, it gets tokenized and embedded, matrices are multiplied, and a next token distribution is returned. The era of frontier models demands a pioneering spirit to navigate. Thus, despite not being familiar with modern machine learning techniques, I started hacking on a script to somehow visualize the layerwise transformation of the hidden states of a large language model small enough to run on my 3060.
A while back, I saw a post on Reddit for a project called NeuralFlow, which was a Python script you could run to get a visualization of the activations of a LLM. The author was using it to help with Mistral 7B fine-tunes, where the visualization conveyed when a model was well-baked but not overdone. All it takes is a couple hundred lines of Python (which I am familiar with) and some torch/numpy/hf transformers matrix munging.
For me, what I want a visualization for is to help understand the geometry of the latent space of the model and how it evolves in the layerwise transformation while running inference. Recently, on a bit of a lark, I read the book "When Time Breaks Down: The Three-Dimensional Dynamics of Electrochemical Waves and Cardiac Arrhythmias" by Arthur Winfree. Though written in 1987, it contained a lot of fascinating ideas about phase singularities and the topology of scroll waves in 3 dimensional active media like heart tissue and the Belousov-Zhabotinsky reaction. "Singularities", while being a bit of an overloaded term, links a lot of interesting things beyond trite futurism. Going back to large language models, it quickly brings to mind Singular Learning Theory, whose singularities are more related to the information geometry of a learning model. Might there be something going on inside them that looks like either of these cases, or even a scan of a brain? On this basis I named the project weightscan, in the hope I could produce something that looks like an fMRI to shed light on the structure of the hidden state of the Transformer.
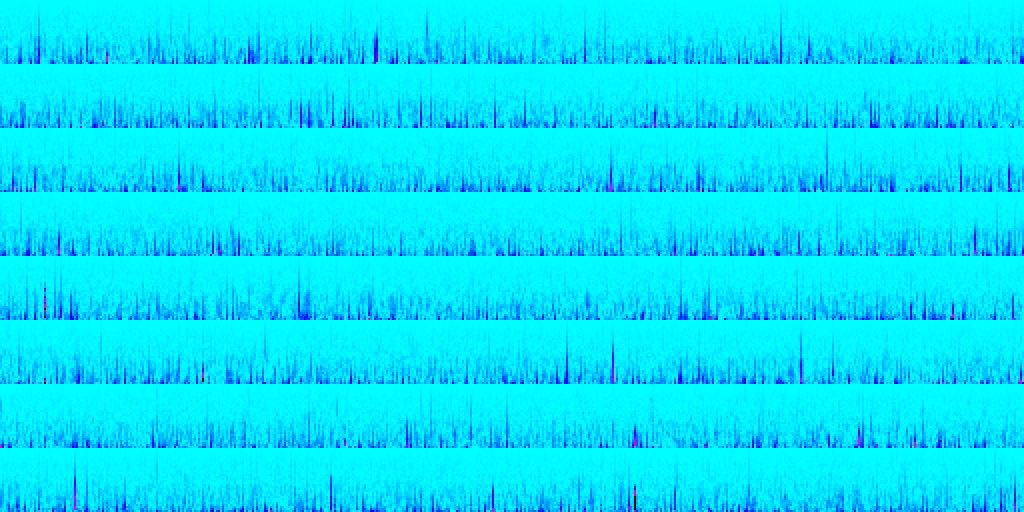
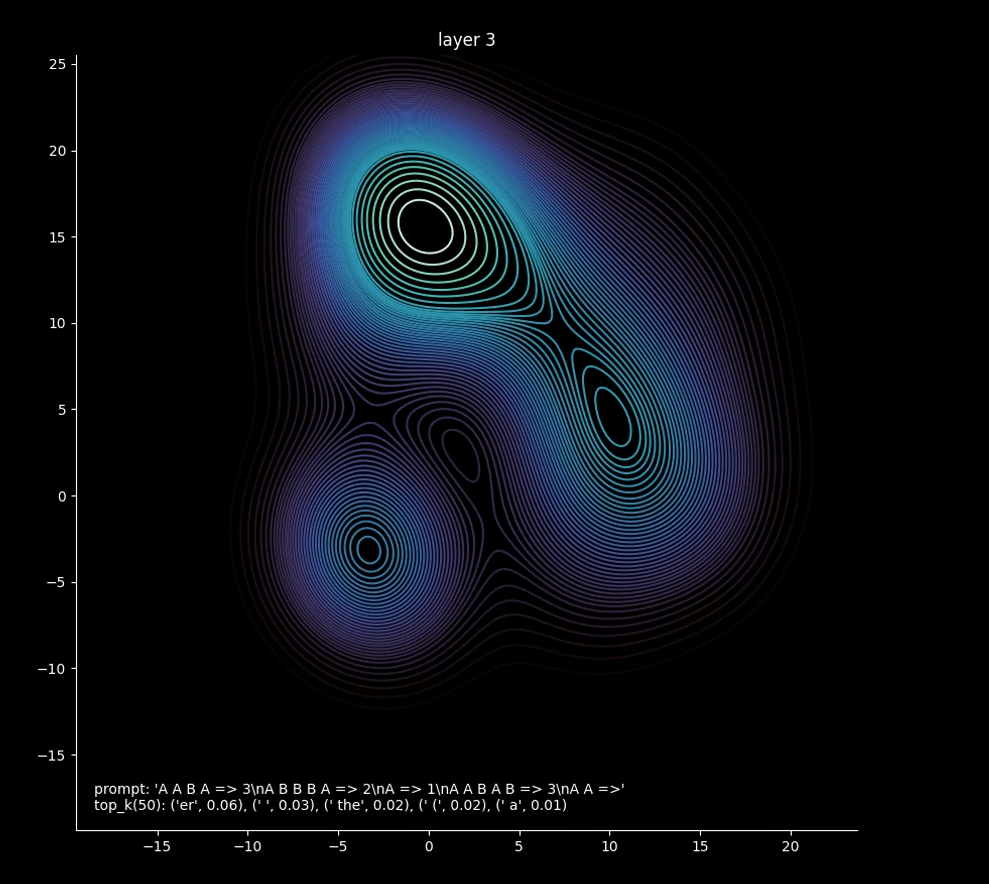
First, I simply passed the layer outputs of the model into UMAP, down to 2 dimensions. To visualize geometry, I mapped those to a density plot, and wrote out an mp4. Success? Well, no. There was some interesting stuff going on, but obviously not enough for what was happening in the model (I started off using Phi 2, but eventually ended using Phi 3). Mostly, there were only a few points, and you can only get so much information from a few 2d points.
A video of the earlier 2d visualization
I realized then a consequence of a very basic fact about transformer-based LLMs - the dimension of the hidden state is proportional to the sequence length, as each token in the input sequence gets embedded and positionally encoded. This isn't intuitive, as the output is only one token, but for attention to work as it does it needs to operate on the sequence as a whole. Recent papers have shown how even otherwise blank tokens can determine the performance of the activation as a whole. So, I wanted to normalize the hidden states, from the sequence length to a large constant that would represent that many particles. To do this, I built a simple autoencoder with the help of ChatGPT, which was trained on the hidden states of the activation (of dimension sequenceLength x hiddenSize) to output 1024 16-dimensional vectors, which I could then pass into UMAP as before and get 1024 2d points. In 2d, however, you lose too much information with the transformation. 3d offers an additional degree of freedom which is crucial to displaying geometric information, while also being the familiar dimension of everyday life. First I changed my code to have UMAP output 3d points and flatten them in my visualization, which was itself intriguing enough to begin building a 3d viewer.
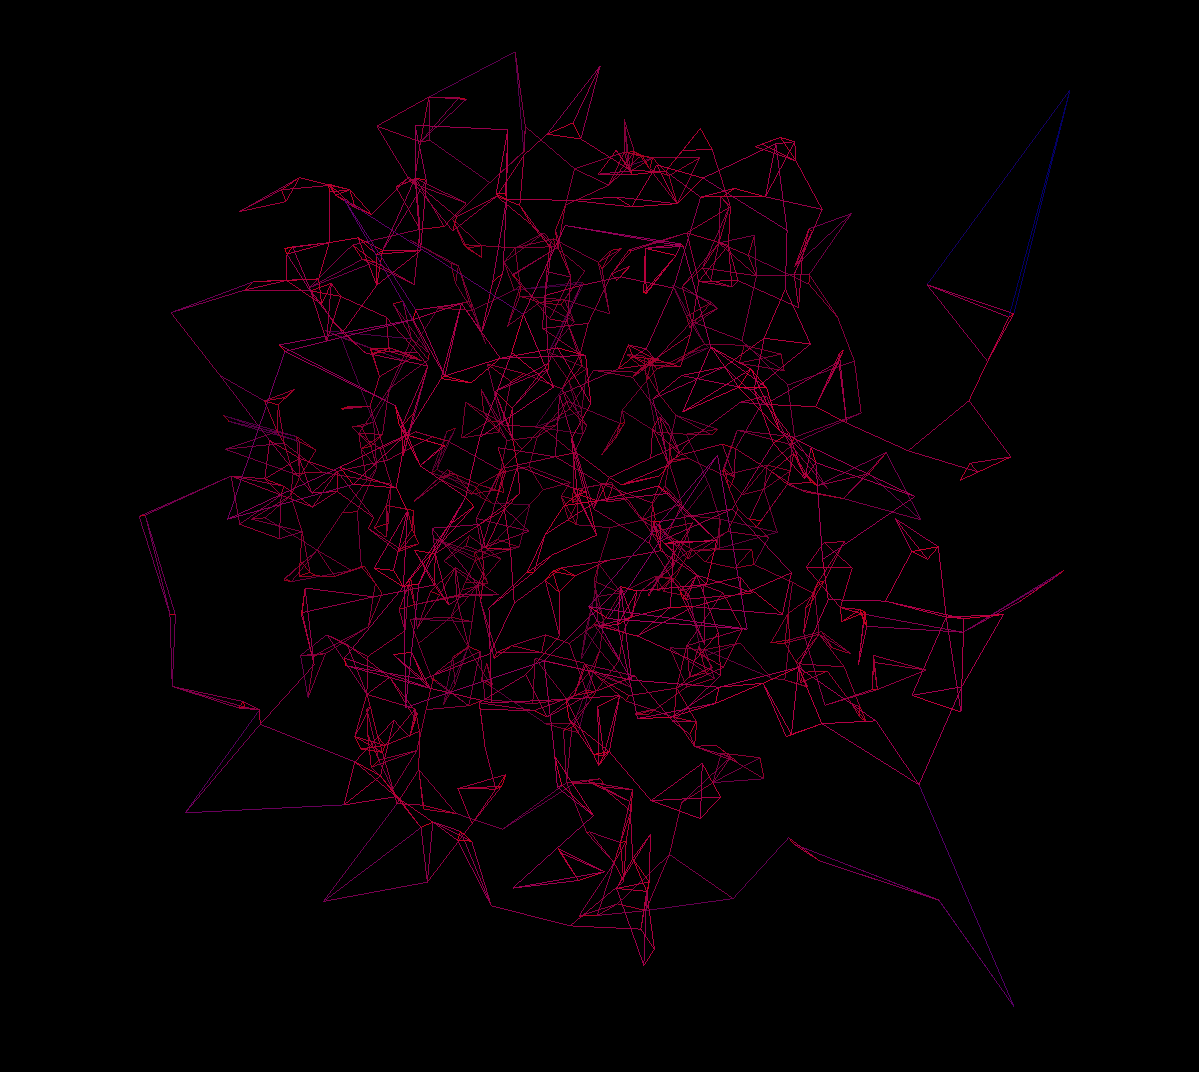
Though there are some Python libraries to do 3d visualizations in, I wasn't familiar with any, and attempts to use open3d e.g. were met with failure. So, I returned to the web to build a visualization using Three.js. I didn't want to have to have a build process or host a server to get the points data from the Python script to the web page, so I just made it a template that I could write the data in from the script, which worked fine. Once again I used ChatGPT to help with the Three.js code - there is nowhere it shines better than to help getting started with a new thing, instead of wading into the million vacuous tutorials that exist and hoping you find a good one, or relying on the design of the library documentation. After some tweaking, I got a nice 3d visualization that let me see the evolution of the geometry of the hidden state of the model (through the lens of my autoencoder and UMAP, of course).
It takes a bit to load all those points - certainly there's some optimization left to do. I tried to find a better way to reconstruct the mesh from the points, but the surface reconstruction tools in open3d were unsatisfactory and I didn't want to get too dragged down into the weeds there. To get it to a reasonable state I balanced the output dimension of the autoencoder (which also increases the time it takes UMAP to run) - I ended up at 1024.
Try the visualization here for a "pre-baked" prompt
The visualization comes with a few controls beyond rotating with the mouse and zooming. Pressing space pauses the animation, and [ and ] manually changes the frame. I want to build an application that takes prompts through the pipeline so you can compare them and adjust parameters, but that will take a good deal more of work. What would be really useful is to use it to diff 2 similar prompts but with a crucial part changed, to see where that is in the geometry.
Staring at the outputs during this project has led me to see the process of the activation of a transformer as occuring over what I call "layer-time". That is to say, each layer represents a stepwise non-linear transformation of the hidden state, as we might get from measuring the state of a system like Winfree was studying. While my visualization doesn't show any scroll waves, I believe there is some way to reveal an equivalent playing out over the 30 or so layers of the model, that will shed light on the physics of meaning. Now, back to remembering how to do Python and shopping for a 4090.